Paper Cup Manufacturing Cost Analysis: Understanding Every Cost Component
Whether you are planning to start a paper cup manufacturing business, expand an existing factory, or evaluate investment opportunities, understanding the real cost of producing a paper cup is essential.
Many new investors focus only on machine prices, but the actual cost of paper cup production includes raw materials, printing, die cutting, cup forming, labor, electricity, waste, maintenance, depreciation, and logistics. Even small improvements in efficiency can significantly impact profitability when producing millions of cups annually.
This guide provides a practical cost analysis covering every major production stage, along with formulas and examples that can help manufacturers estimate production costs more accurately.
What Determines the Cost of a Paper Cup?
The manufacturing cost of a paper cup depends on several variables:
- Paper weight and material quality
- Cup size and design
- Printing requirements
- Production volume
- Machine efficiency
- Labor costs
- Waste rates
- Energy consumption
- Factory location
Although costs vary by country and production scale, most paper cup factories share a similar production workflow:
PE-Coated Paper Roll → Printing → Die Cutting → Cup Forming → Inspection → Packing
Understanding the cost contribution of each stage allows manufacturers to identify opportunities for savings and productivity improvements.
Stage 1: PE-Coated Paper Roll Cost
PE-coated paper is the primary raw material used for paper cup production. It combines food-grade paperboard with a polyethylene coating that provides moisture resistance and heat sealing capability.
Typical Material Specifications
| Item | Typical Range |
|---|---|
| Base Paper Weight | 170–350 gsm |
| PE Coating | 10–20 gsm |
| Roll Width | 800–1200 mm |
| Paper Consumption Per Cup | 6–10 g |
Typical Raw Material Cost Structure
| Cost Component | Typical Cost (USD/Ton) |
|---|---|
| Food Grade Base Paper | 950–1200 |
| PE Coating | 100–180 |
| Lamination Processing | 60–100 |
| Material Waste | 30–60 |
| Logistics | 80–150 |
Raw Material Cost Formula
Variables:
- W = Paper weight per cup (grams)
- P = Paper cost per ton (USD)
Formula:
Cost Per Cup = (W ÷ 1,000,000) × P
Example:
W = 7.5 g
P = 1200 USD/ton

Cost Per Cup
= (7.5 ÷ 1,000,000) × 1200
= 0.009 USD
For most paper cup factories, raw materials account for 60%–75% of total production costs, making material utilization one of the most important profitability factors.
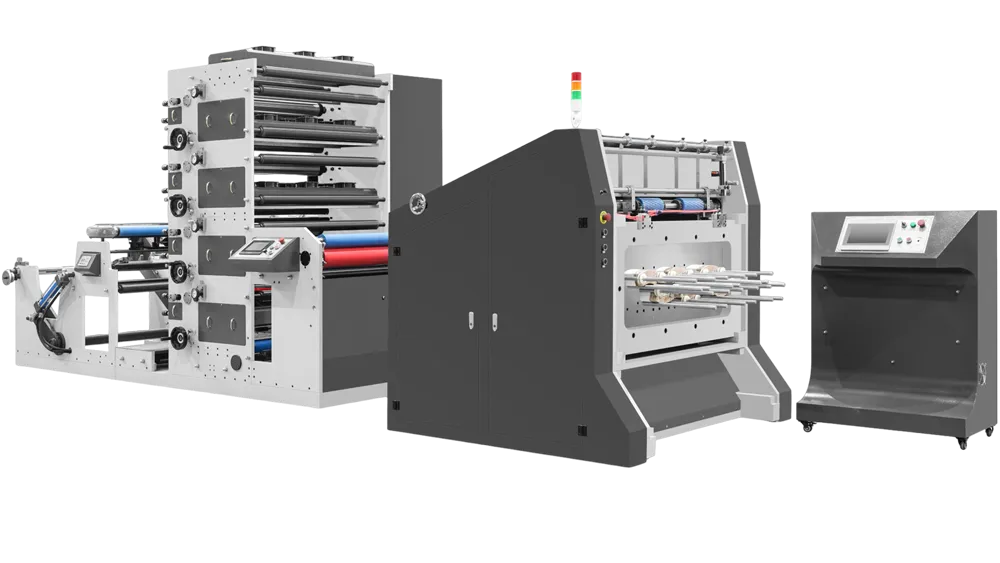
Stage 2: Printing Cost Analysis
Most commercial paper cups require custom branding, logos, product information, or promotional graphics. Printing is typically performed before die cutting using a paper cup printing machine.
Typical Printing Costs
| Cost Component | Typical Cost |
|---|---|
| Water-Based Ink | 20–40 USD/Ton |
| Printing Plates | 60–150 USD/Color |
| Setup & Cleaning | 100–300 USD/Job |
| Printing Waste | 2–5% |
Printing Cost Formula
Variables:
- Pprint = Total printing cost per ton
- N = Number of cups produced from one ton
Printing Cost Per Cup = Pprint ÷ N
Example:
Pprint = 135 USD
N = 40,000 Cups

Printing Cost Per Cup
= 135 ÷ 40,000
= 0.0034 USD
Printing cost increases with additional colors, tighter registration requirements, specialty inks, and smaller production runs.
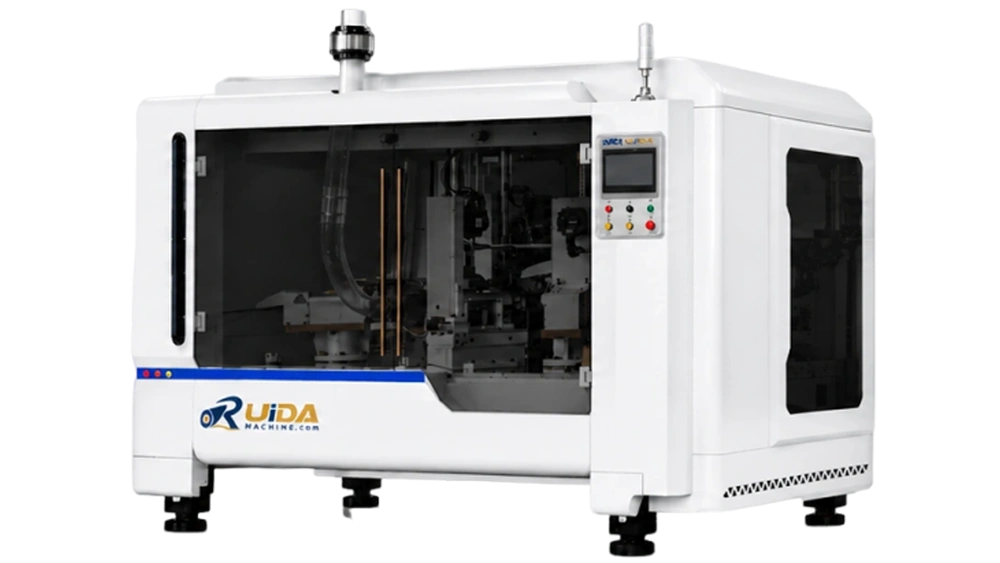
Stage 3: Die Cutting Cost Analysis
After printing, the paper roll enters the die cutting stage where fan-shaped cup blanks are produced.
This process is performed using a paper cup die cutting machine and directly affects material utilization and cup forming consistency.
Typical Die Cutting Costs
| Cost Element | Typical Value |
|---|---|
| Operator Labor | 25–50 USD/Day |
| Die Maintenance | 200–500 USD / 1M Blanks |
| Electricity | 2–4 kWh/Hour |
| Paper Scrap | 10–14% |
Die Cutting Cost Formula
Variables:
- Cdie = Total die cutting cost per day
- Qdaily = Daily output
Die Cutting Cost Per Cup = Cdie ÷ Qdaily
Example:
Cdie = 200 USD
Qdaily = 40,000 Cups

Cost Per Cup
= 200 ÷ 40,000
= 0.005 USD
Optimizing die layout and reducing paper scrap can significantly lower material costs over large production volumes.
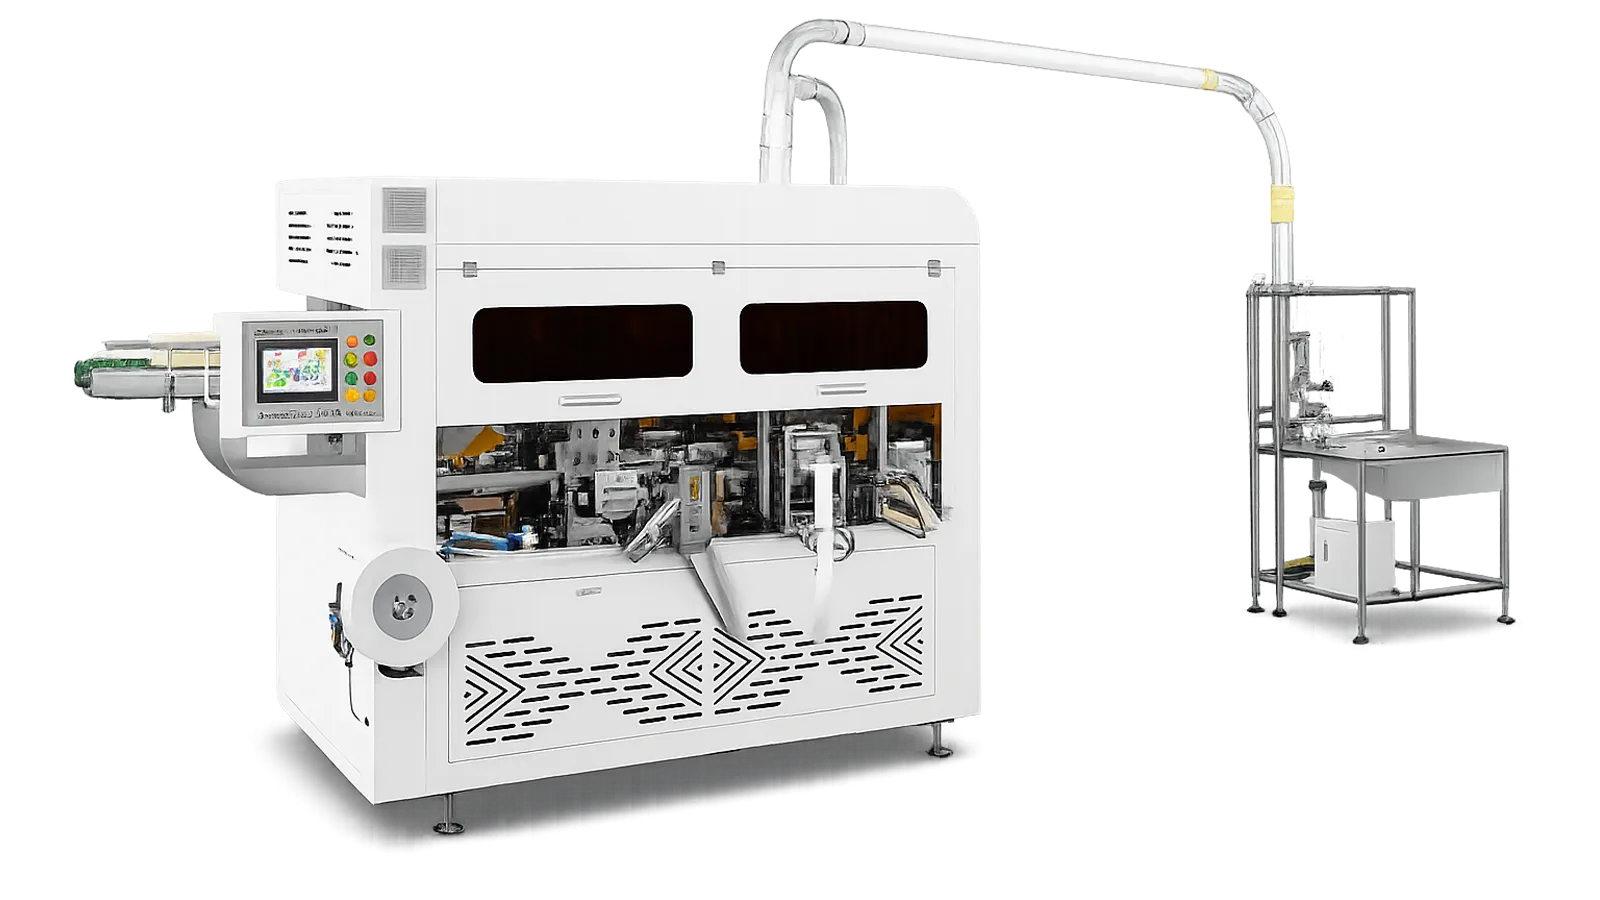
Stage 4: Paper Cup Forming Cost Analysis
The forming stage converts fan blanks and bottom discs into finished cups using heat sealing, curling, knurling, and stacking processes.
This stage typically uses a paper cup forming machine and directly affects productivity, defect rates, and labor requirements.
Typical Forming Costs
| Cost Component | Typical Cost |
|---|---|
| Bottom Roll Paper | Approximately 15% of paper cost |
| Machine Depreciation | 0.001–0.002 USD/Cup |
| Labor | 1–2 Operators |
| Electricity | 4–8 kWh/Hour |
| Reject Rate | 2–6% |
Forming Cost Formula
Variables:
- Cform = Forming cost
- L = Labor cost
- E = Energy cost
Forming Cost Per Cup
= Cform + L + E
Example:
Cform = 0.0058 USD
L = 0.0012 USD
E = 0.0005 USD

Total Forming Cost
= 0.0075 USD
Modern automatic machines can reduce labor costs while improving output consistency and lowering rejection rates.
Labor Cost Calculation
Labor costs vary significantly by country and factory size.
| Region | Estimated Labor Cost Contribution |
|---|---|
| China | 5–10% |
| Southeast Asia | 4–12% |
| Middle East | 6–15% |
| Europe | 15–25% |
| North America | 15–30% |
As labor costs rise globally, many manufacturers are investing in higher-speed automated paper cup production lines to improve profitability.
Electricity Cost Analysis
Energy consumption is usually lower than raw material costs but still affects long-term production economics.
| Equipment | Power Consumption |
|---|---|
| Printing Machine | 8–20 kWh/hour |
| Die Cutting Machine | 2–6 kWh/hour |
| Paper Cup Machine | 4–10 kWh/hour |
Factories operating multiple shifts can reduce energy costs through efficient machine scheduling and preventive maintenance.
Waste Cost Analysis
Waste is one of the most overlooked cost drivers in paper cup manufacturing.
| Waste Source | Typical Rate | Optimization Method |
|---|---|---|
| Lamination Loss | 2–4% | Optimize roll width selection |
| Printing Waste | 1–3% | Improve registration accuracy |
| Die Cutting Scrap | 10–14% | Improve nesting efficiency |
| Forming Rejects | 2–6% | Use stable molds and automation |
Reducing total waste from 20% to 10% can generate substantial savings across millions of cups annually.
Example: Total Manufacturing Cost of an 8oz Paper Cup
| Production Stage | Cost Per Cup (USD) |
|---|---|
| PE-Coated Paper | 0.0090 |
| Printing | 0.0034 |
| Die Cutting | 0.0050 |
| Forming | 0.0058 |
| Total Manufacturing Cost | 0.0232 |
Actual production costs will vary depending on cup size, paper grade, local labor rates, production volume, waste rates, and machine efficiency.
How to Reduce Paper Cup Manufacturing Costs
- Use optimized die cutting layouts to reduce paper scrap.
- Reduce machine downtime through preventive maintenance.
- Improve printing registration accuracy.
- Select appropriate paper weight for the application.
- Increase automation where labor costs are high.
- Monitor waste rates at every production stage.
- Invest in stable, high-speed production equipment.
Cost reduction should focus on improving efficiency rather than simply purchasing cheaper materials. Poor-quality materials often create higher waste rates and lower production stability.
FAQ: Paper Cup Manufacturing Costs
What is the biggest cost in paper cup production?
Raw material cost is usually the largest expense, often accounting for 60%–75% of total manufacturing costs.
How many paper cups can be produced from one ton of paper?
The answer depends on cup size and paper weight. Many 8oz paper cups consume approximately 7–8 grams of paper, resulting in roughly 125,000–140,000 cups per ton of material before waste.
How much does printing add to paper cup cost?
Printing typically adds around 0.002–0.005 USD per cup depending on color quantity, order size, and printing technology.
How can manufacturers reduce production waste?
Waste can be reduced through better die layouts, accurate printing registration, machine maintenance, operator training, and high-quality raw materials.
Is automation worth the investment?
For medium and large production volumes, automation often reduces labor costs, improves consistency, lowers waste, and increases long-term profitability.
Final Thoughts
Understanding paper cup manufacturing costs is essential for accurate pricing, profitability analysis, production planning, and investment decisions. By evaluating each stage—from PE-coated paper rolls to printing, die cutting, and cup forming—manufacturers can identify opportunities to reduce waste and improve efficiency.
For customized paper cup cost calculations, production line planning, machine selection, and technical consultation, Ruida Machinery can help evaluate your project requirements and recommend practical production solutions based on your cup specifications and target output.